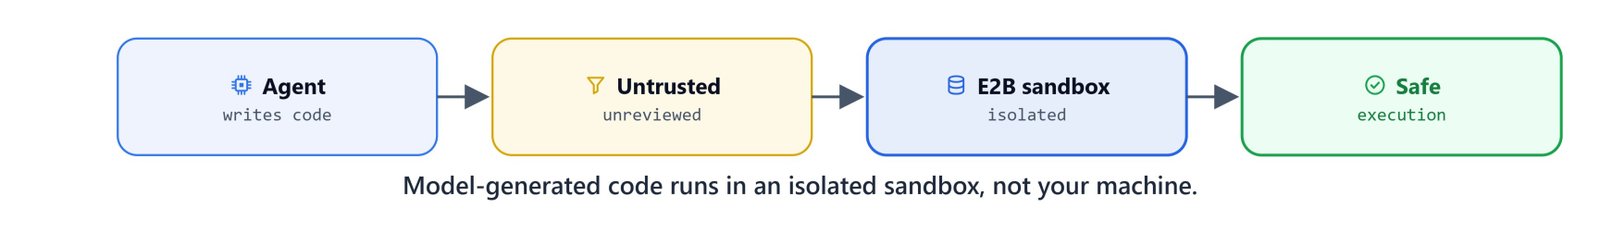
When an agent writes Python and runs it, that code is untrusted. A model generated it, and no one reviewed it. Running it directly on our machine is a security risk. So here comes the E2B sandbox to the rescue. It is an isolated cloud environment where AI-generated code runs safely, away from our files and network.
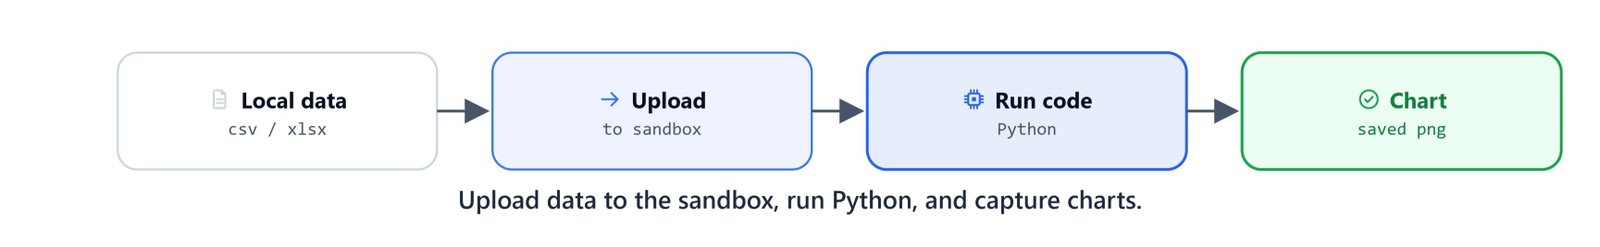
In this blog, we build a code-execution agent. It uploads a data file to an E2B sandbox, runs analysis code there, captures any charts, and returns the results. Gemini handles the reasoning, and a strict system prompt forces a disciplined explore-then-analyze workflow.
Note
This project uses create_agent with custom tools, a checkpointer, and middleware. If those are unfamiliar, review LangChain Agent Fundamentals first.
Why a Sandbox?
The core security rule is simple: never run model-generated code in our own process. A sandbox gives us isolation, resource limits, and a clean environment we can throw away after use. E2B provides exactly this: a remote interpreter we control through a small Python SDK.
Important
E2B requires an API key. Sign up and create a key (search "E2B sandbox e2b.dev" for the official site), then add it to your .env file as E2B_API_KEY=your_key_here.
Setup and Imports
Import LangChain, Gemini, and the E2B interpreter. The Sandbox class is the handle to our remote environment:
import warnings
warnings.filterwarnings('ignore')

import os
import base64
import pandas as pd
import time

from dotenv import load_dotenv
load_dotenv()

from langchain_google_genai import ChatGoogleGenerativeAI
from langchain.tools import tool
from langchain.agents import create_agent
from langchain.messages import HumanMessage
from langgraph.checkpoint.memory import InMemorySaver

from e2b_code_interpreter import Sandbox

model = ChatGoogleGenerativeAI(model='gemini-3-flash-preview')
checkpointer = InMemorySaver()
Running Code in the Sandbox
Create a sandbox with a timeout (here 40 minutes) and run code with run_code. Errors are captured, not raised into our program. That is exactly what we want for untrusted code:
sbx = Sandbox.create(timeout=40*60)

response = sbx.run_code('print(2+2)')
response = sbx.run_code('print(2/0)')
responseExecution(Results: [], Logs: Logs(stdout: [], stderr: []),
Error: ExecutionError(name='ZeroDivisionError', value='division by zero', ...))Here, we can see the 2/0 error stay inside the sandbox and come back as a structured ExecutionError. The sandbox can also produce rich results like charts. When code creates a matplotlib figure, E2B returns it as a result object holding a PNG:
code = """import pandas as pd
import matplotlib.pyplot as plt

data = {
    'product': ['Laptop', 'Mouse', 'Keyboard', 'Monitor', 'Headphones',
                'Laptop', 'Mouse', 'Keyboard', 'Monitor', 'Laptop'],
    'quantity': [5, 15, 10, 3, 8, 4, 20, 12, 2, 6],
    'price': [1200, 25, 75, 350, 150, 1200, 25, 75, 350, 1200]
}

df = pd.DataFrame(data)
df['revenue'] = df['quantity'] * df['price']
product_revenue = df.groupby('product')['revenue'].sum().sort_values(ascending=False)

print("Total Revenue by Product:")
print(product_revenue)

plt.figure(figsize=(10, 6))
product_revenue.plot(kind='bar', color='steelblue')
plt.title('Total Revenue by Product', fontsize=16, fontweight='bold')
plt.xlabel('Product'); plt.ylabel('Revenue ($)')
plt.xticks(rotation=45)
plt.tight_layout()"""

response = sbx.run_code(code)
responseExecution(Results: [Result(<Figure size 1000x600 with 1 Axes>)],
Logs: Logs(stdout: ['Total Revenue by Product:\nproduct\nLaptop 18000\nMonitor 1750\n...'], stderr: []),
Error: None)The figure is available as response.results[0].png (base64), which we will save to disk inside the tool.
Building the Agent Tools
The agent needs two tools: one to move a local data file into the sandbox, and one to run code there.
Inspecting a Dataset
A small helper peeks at a file's columns and a few rows so we can sanity-check uploads:
def get_dataset_info(file_path):
    if file_path.endswith('.csv'):
        df = pd.read_csv(file_path, nrows=3)
    else:
        df = pd.read_excel(file_path, nrows=3)
    return f"Columns: {list(df.columns)}\n Sample data:\n{df.to_string()}"
The Upload Tool
upload_file reads a file from the local ./data directory and writes it into the sandbox's /home/user/data/ folder:
@tool
def upload_file(local_file_name: str):
    """Upload a data file to the E2B sandbox for analysis.

    Args:
        local_file_name: File name in ./data (e.g., "IMDB-Movie-Data.csv")

    Returns:
        Success message with the sandbox path.
    """
    local_file_name = local_file_name.lstrip('/').lstrip('\\')
    local_file_path = f"./data/{local_file_name}"

    if not os.path.exists(local_file_path):
        return f"Error: file not found at {local_file_path}"

    with open(local_file_path, "rb") as f:
        sandbox_file = sbx.files.write(f"data/{local_file_name}", f)

    return f"File uploaded successfully!\nSandbox path: {sandbox_file.path}"

upload_file.invoke("apple_2024.xlsx")File uploaded successfully!
Sandbox path: /home/user/data/apple_2024.xlsxThe Code Execution Tool
run_python_code runs code in the sandbox, returns errors gracefully, and saves any generated chart PNGs to a local images/ folder with a timestamped name:
@tool
def run_python_code(code: str):
    """Execute Python code in the E2B sandbox.

    Args:
        code: Valid executable Python code only.

    Returns:
        Execution result, plus paths to any saved charts.
    """
    print('Running code in sandbox....')
    execution = sbx.run_code(code)
    print('Code execution is done!')

    if execution.error:
        return f"Error: {execution.error.name}\nValue: {execution.error.value}"

    os.makedirs('images', exist_ok=True)
    output = []
    timestamp = int(time.time())
    output.append(str(execution))

    for idx, result in enumerate(execution.results):
        if result.png:
            filename = f'images/{timestamp}_chart_{idx}.png'
            with open(filename, 'wb') as f:
                f.write(base64.b64decode(result.png))
            output.append(f"Chart saved to {filename}")

    return "\n".join(output) if output else "Code executed but no output was returned"
The Data-Analysis System Prompt
The agent's reliability comes from a strict prompt (stored in scripts/prompts.py as CODE_EXECUTION_PROMPT). It forces the agent to act by calling tools, always explore the dataset first, and use multiple small code steps rather than one giant block:

CODE_EXECUTION_PROMPT = """You are a data analysis assistant. You MUST use the available tools to complete tasks.

WORKFLOW - Follow these steps in order:
1. Search for data files using glob_search (for LOCAL file discovery only)
2. Upload file using upload_file (transfers from local to sandbox)
3. ANALYZE THE DATASET FIRST - Use run_python_code to check shape, columns,
   data types, first rows, null values, and df.describe()
4. PERFORM ANALYSIS - Use run_python_code multiple times to clean, aggregate, and answer
5. CREATE VISUALIZATIONS (if requested) - matplotlib with titles/labels, use plt.show()

CRITICAL RULES:
- You MUST call the appropriate tool for each step - do not just think, ACT by calling tools
- NEVER skip the dataset exploration step
- Use run_python_code multiple times rather than one large code block
- All file paths in code must use '/home/user/data/' prefix"""
Tip
The prompt also tells the agent to only plot when the user explicitly asks ("plot", "chart", "graph", "visualize") and to always read Excel files sheet by sheet. Strict, explicit prompts like this are what make tool-using agents dependable.
Assembling the Agent
Create the agent with both tools and the prompt. We add FilesystemFileSearchMiddleware so the agent can discover files in the local ./data directory on its own:
from scripts import prompts
from langchain.agents.middleware import FilesystemFileSearchMiddleware

agent = create_agent(
    model=model,
    tools=[upload_file, run_python_code],
    system_prompt=prompts.CODE_EXECUTION_PROMPT,
    checkpointer=checkpointer,
    middleware=[
        FilesystemFileSearchMiddleware(
            root_path="./data",
            use_ripgrep=True,
            max_file_size_mb=1000)
    ]
)
Running Real Analyses
Invoke the agent with a thread_id so each analysis keeps its context. Watch the console print each sandbox run as the agent works through explore → analyze → visualize.
Titanic Survival by Class
config = {"configurable": {"thread_id": "titanic-1"}}

query = """Using titanic.csv, calculate the survival rate for each passenger class (Pclass)
and create a bar chart where the x-axis is Pclass (1, 2, 3) and the y-axis is survival rate."""

result = agent.invoke({"messages": [HumanMessage(content=query)]}, config=config)
print(result['messages'][-1].text)Running code in sandbox....
Code execution is done!
Running code in sandbox....
Code execution is done!
Based on titanic.csv, survival rates by passenger class are:
* Class 1 (First Class): 63.0%
* Class 2 (Second Class): 47.3%
* Class 3 (Third Class): 24.2%
The chart shows a clear correlation between class and survival.Survival by Gender
query = """From titanic.csv, group passengers by Sex and Survived, then create a grouped bar
chart where the x-axis is Sex, the y-axis is passenger count, split by survival status."""

result = agent.invoke({"messages": [HumanMessage(content=query)]}, config=config)
print(result['messages'][-1].text)The survival distribution by gender reveals a significant disparity:
1. Female survival: 233 survived vs 81 perished (~74.2%).
2. Male survival: 109 survived vs 468 perished (~18.9%).
3. These results reflect the "women and children first" evacuation protocol.Fare vs Survival (Box Plot)
query = """Using the Fare column from titanic.csv, create a box plot comparing ticket fares
of survivors and non-survivors, with Survived on the x-axis and Fare on the y-axis.
Apply a logarithmic scale if values are highly skewed."""

result = agent.invoke({"messages": [HumanMessage(content=query)]}, config=config)
print(result['messages'][-1].text)What the visualization reveals:
1. Higher median fare for survivors (£26.0) vs those who died (£10.5).
2. Non-survivors concentrate among cheaper, third-class tickets.
3. Wealthier passengers had prioritized access to lifeboats.Financial Analysis on Excel
The same agent handles Excel financial statements. Because the prompt enforces sheet-by-sheet exploration, it works through multi-sheet workbooks reliably:
query = """Analyze the 2024 cash flow and financial performance of Google (Alphabet) and Apple.
Compute Gross Profit Margin, Net Profit Margin, ROA, ROE, Current Ratio, and Debt-to-Equity.
Create a grouped bar chart comparing the two companies and a summary table."""

config = {"configurable": {"thread_id": "finance-plots-1"}}
result = agent.invoke({"messages": [HumanMessage(content=query)]}, config=config)Running code in sandbox....
Code execution is done!
... (the agent uploads both workbooks, explores each sheet, computes ratios,
builds the comparison chart and table, then interprets profitability,
efficiency, liquidity, and leverage differences)The agent ran every line of generated code inside the E2B sandbox. Our machine never executed any of it. This is how we run untrusted code safely, which is the production pattern for data-driven agents.
Caution
Always treat model-generated code as untrusted. Keep execution inside the sandbox, set sensible timeouts, and avoid mounting secrets or sensitive paths into the sandbox environment.
Next, we connect an agent to live spreadsheets and market data in Build a Google Sheets Analysis Agent with MCP.


