MCP tools can do real work beyond toy math. In this blog, Claude Desktop becomes a data analyst. It reads a raw Excel support-ticket dataset through an MCP server, computes the metrics, and writes a PowerPoint report through another MCP server. All of it comes from a single natural-language request.
This shows the "Tools = do something now" side of MCP at its best. We supply data and a goal. Claude then orchestrates the spreadsheet and presentation tools to deliver a finished report.
Note
Prerequisites: the excel, ppt, and filesystem servers registered in Connect MCP Servers to Claude Desktop. Point the filesystem server at the folder that holds your dataset so Claude can read and write files there.
The workflow
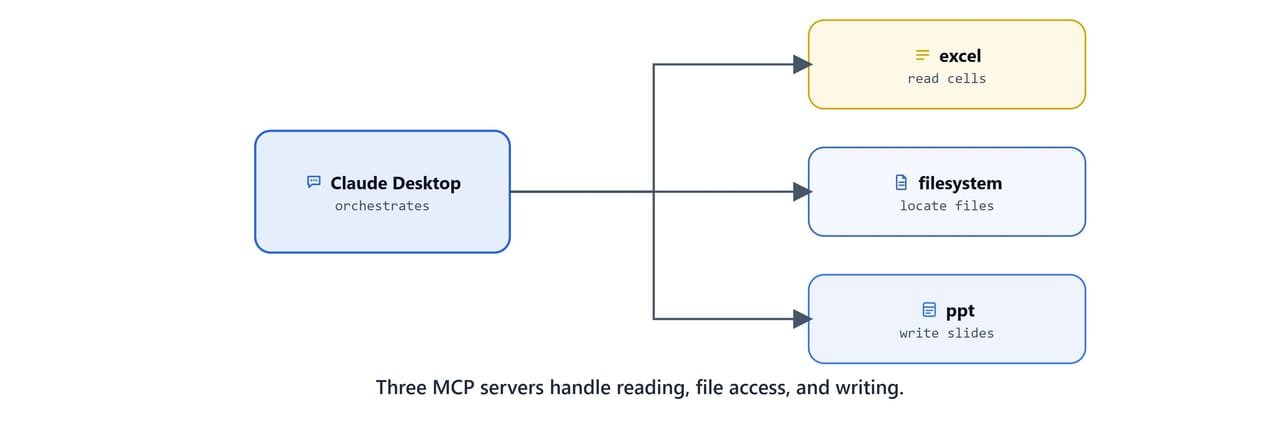
support_tickets_data.xlsx -> Claude Desktop + Excel MCP -> analysis -> PowerPoint MCP -> report.pptx
The three servers each play one role:
- excel (
@negokaz/excel-mcp-server): reads cells, sheets, and ranges from the workbook. - filesystem (
@modelcontextprotocol/server-filesystem): lets Claude locate and save files in an allowed folder. - ppt (
office-powerpoint-mcp-server): creates slides, tables, and text in a.pptxfile.
The dataset
The sample file support_tickets_data.xlsx holds 50 customer-support tickets with these columns:
| Column | Meaning |
|---|---|
ticket_id |
Unique ticket identifier (e.g. T0001) |
customer_id |
Customer identifier (e.g. C0511) |
issue_type |
Category, API Issue, Login Issue, Report Generation, Data Import, Billing, etc. |
issue_description |
Free-text description |
priority |
Low / Medium / High / Critical |
date_submitted |
Date the ticket was opened |
response_time_minutes |
Minutes to first response |
resolution_time_minutes |
Minutes to resolution |
satisfaction_rating |
Customer rating, 1-5 |
customer_comments |
Free-text feedback |
agent_id |
Handling agent (e.g. A004) |
resolved |
True / False |
A few sample rows:
T0001 | C0511 | API Issue        | High | 240 min resp | 927 min resolve | rating 4 | agent A004 | resolved True
T0002 | C0729 | Login Issue      | Low  | 223 min resp | 534 min resolve | rating 5 | agent A004 | resolved False
T0003 | C0439 | Report Generation| Low  | 214 min resp | 592 min resolve | rating 1 | agent A004 | resolved False
Note
This is synthetic sample data created for the course. The customer and agent IDs are not real people. Swap in your own workbook to analyze real tickets.
Prompting Claude to analyze and report
With the servers connected, restart Claude Desktop and give it a single, goal-oriented prompt. For example:
"Read
support_tickets_data.xlsxfrom my Downloads folder using the Excel tools. Analyze support performance, resolution rate, average response and resolution times, customer satisfaction, and per-agent performance. Identify the critical issues and propose an action plan. Then create a PowerPoint report namedSupport_Tickets_Analysis_Report.pptxwith one slide per section."
Claude will, on its own:
- Call the filesystem and excel tools to load the workbook.
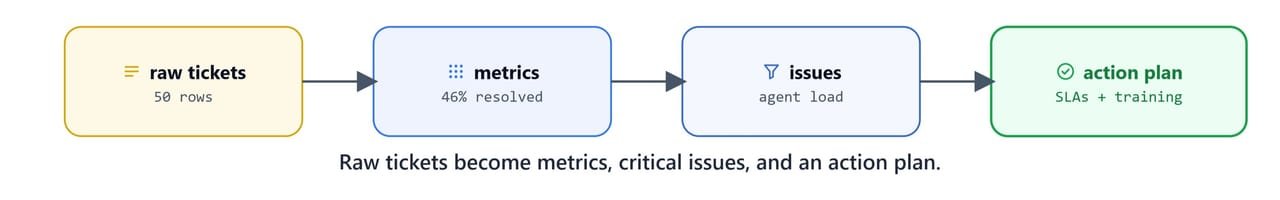
- Compute aggregate metrics across all 50 tickets.
- Group by
agent_id,issue_type, andpriority. - Call the ppt tools to build a multi-slide deck and save it.
Tip
Ask for "one slide per section" and name the output file explicitly. Concrete instructions make the generated deck predictable and easy to review.
What the report contains
The generated deck, Support Tickets Data Analysis Report, Comprehensive Performance Review & Action Plan, comes out as nine slides.
Executive summary, key metrics
- Total tickets: 50 processed.
- Resolution rate: 46% (target 80%+), critical gap.
- Customer satisfaction: 2.84 / 5 (target 4.0+), needs improvement.
- Average response time: 2.2 hours, meeting target.
- Average resolution time: 11.3 hours, exceeds target.
- Resolved: 23, Unresolved: 27.
Agent performance analysis
| Agent | Tickets handled | Resolution rate | Satisfaction | Status |
|---|---|---|---|---|
| A002 | 9 | 66.7% | 2.89/5 | Best performer |
| A003 | 9 | 55.6% | 3.11/5 | Good performance |
| A001 | 7 | 42.9% | 2.14/5 | Needs training |
| A004 | 18 | 38.9% | 2.89/5 | Overloaded |
| A005 | 7 | 28.6% | 2.86/5 | Needs improvement |
Critical issues identified
- Low resolution rate: only 46% resolved (target 80%+).
- Poor customer satisfaction: 2.84/5 average.
- Agent A001 has the lowest satisfaction scores (2.14/5).
- Agent A004 workload imbalance: handling 36% of all tickets.
- Only 42.9% of critical tickets are resolved.
Immediate action plan
- Train Agent A001 on customer-service and communication skills.
- Redistribute Agent A004's workload to other available agents.
- Create specialized teams for Data Import (22%) and Billing Issues (22%).
- Establish a 4-hour SLA for critical tickets with escalation protocols.
- Auto-escalate tickets older than 8 hours to senior support.
- Track resolution rate weekly and satisfaction monthly.
Success targets
| Metric | Current | Target |
|---|---|---|
| Resolution Rate | 46% | 80%+ |
| Customer Satisfaction | 2.84/5 | 4.0/5 |
| Response Time | 2.2 hours | Under 2 hours |
| Resolution Time | 11.3 hours | Under 8 hours |
The closing slide notes the analysis was completed using Claude MCP analysis, with a 3-6 month timeline for hitting the targets.
Important
Always spot-check the numbers in a generated report against the source data before sharing it. The model computed these from the workbook, but we own the final accuracy.
Why this matters
We just ran a complete analytics pipeline. We did ingest, analyze, and present, without writing a single line of pandas or python-pptx. The Excel and PowerPoint MCP servers did the I/O. Claude did the reasoning and orchestration.
This is the practical payoff of MCP tools. Next, we will understand exactly how tools differ from resources and prompts, and when to use each, in MCP Tools, Resources, and Prompts.


