Real-Time Twitter Sentiment Analysis
Donald Trump vs Warren Twitter Sentiment | US Election 2020
In this project we are going to extract live data from twitter related to Donald Trump and Elizabeth Warren. We are going to analyze the sentiment of the data and then plot the data in a single graph which will update in real time.
Before starting this project you will have to create a new application by visiting this link.
https://developer.twitter.com/app/new
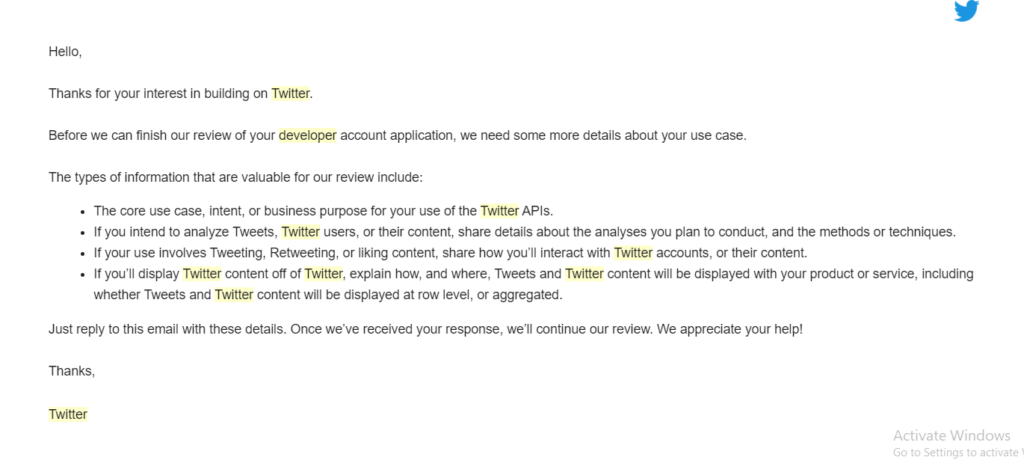
Here, you will have to create a developer account. After you sign up for the developer account your twitter profile will be reviewed. You will get an email similar to this.
After that you can create a new application. You will have to give details about the project you are using the API for. After you create the application you will get 4 keys- API key, API secret key, Access token and Access token secret.
Now we will install and import tweepy which will help us to get data from twitter.
!pip install tweepy
import tweepy
Here we have stored the 4 keys which we have got. You should use your own APIs.
consumer_key = "SaMSYfPnpQXsgeEFywA8pLg1C"
consumer_secret = "o9BjVfJHhxWmPOAT39f7i0KHJuwGb8r9k1VjHQvl4q51Gaz5I5"
access_token = "2238923408-XqfhQ40evLEZSVDUYAlZmLJF6IJXR0SCtp04Xy7"
access_token_secret = "BKqoLg2YglIqm0txjSI9oahhecxWox6a4q7g66iQe5ZvA"
Now we will do authorization. We have created an OAuthHandler instance in which we pass the consumer token and secret. We will set the access tokens using set_access_token(). Finally, we will get the API using tweepy.API().
auth = tweepy.OAuthHandler(consumer_key, consumer_secret)
auth.set_access_token(access_token, access_token_secret)
api = tweepy.API(auth)
Get my timeline
home_timeline() returns a collection of the most recent Tweets and Retweets posted by the authenticating user and the users they follow. It also contains all the details about that tweet. We are going to use .text to extract only the text from the tweets.
twittes = api.home_timeline()
for tweet in twittes:
    print(tweet.text)
Get twitts stream and do sentiment analysis
By the above method we only get a limited number of tweets. Now we will see how to get a continuous stream of tweets.
First we are importing the necessary libraries.
StreamandStreamListeneris imported fromtweepyto get continuous data from twitter.jsonis imported to get the actual tweet.Textblobis imported fromtextblobfor sentiment analysis.reis used to filter out the tweets.csvis used to make a csv file of the tweets.
You can install textblob by running the following command
!pip install textblob
To learn more about textblob and sentiment analysis using textblob you can watch this video
from tweepy import Stream
from tweepy import StreamListener
import json
from  textblob import TextBlob
import re
import csv
First we are creating a csv file sentiment.csv to save the data extracted from twitter to draw the plot. csv.DictWriter() creates an object which operates like a regular writer but maps dictionaries onto output rows. The writeheader() method writes the headers to the CSV file.
We are going to create a class Listener(). This simple stream listener prints status text. The on_data method of Tweepy’s StreamListener conveniently passes data from statuses to the on_status method. We are going to override on_data().
json.load() takes a file object and returns the json object. A JSON object contains data in the form of key/value pair.
We only need plain text for sentiment analysis. So using re we will remove all the links, emojis, special characters, punctuations, etc. We are even removing ‘RT’ which is there in all retweets.
Now we will perform sentiment analysis usingtextblob. sentiment returns a tuple of form (polarity, subjectivity) where polarity is a float within the range [-1.0, 1.0] where -1.0 is very negative and 1.0 is very positive and subjectivity is a float within the range [0.0, 1.0] where 0.0 is very objective and 1.0 is very subjective. For every tweet we are going to check if the tweet is related to Trump or if it is related to Warren. Then we are going to add the polarity of the current tweet to the sum of the earlier polarities and write it to the csv file under the appropriate header.
trump = 0
warren = 0

header_name = ['Trump', 'Warren']
with open('sentiment.csv', 'w') as file:
    writer = csv.DictWriter(file, fieldnames=header_name)
    writer.writeheader()

class Listener(StreamListener):

    def on_data(self, data):
        raw_twitts = json.loads(data)
        try:
            tweets = raw_twitts['text']

            tweets = ' '.join(re.sub("(@[A-Za-z0-9]+)|([^0-9A-Za-z \t])|(\w+:\/\/\S+)", " ", tweets).split())
            tweets = ' '.join(re.sub('RT',' ', tweets).split())

            blob = TextBlob(tweets.strip())

            global trump
            global warren

            trump_sentiment = 0
            warren_sentiment = 0

            for sent in blob.sentences:
                if "Trump" in sent and "Warren" not in sent:
                    trump_sentiment = trump_sentiment + sent.sentiment.polarity
                else:
                    warren_sentiment = warren_sentiment + sent.sentiment.polarity

            trump = trump + trump_sentiment
            warren = warren + warren_sentiment

            with open('sentiment.csv', 'a') as file:
                writer = csv.DictWriter(file, fieldnames=header_name)
                info = {
                    'Trump': trump,
                    'Warren': warren
                }
                writer.writerow(info)

            print(tweets)
            print()
        except:
            print('Found an Error')

    def on_error(self, status):
        print(status)
We need an api to stream. We have an api auth and a status listener Listener() so now we can create our stream object twitter_stream.
Then we will use filter to stream all tweets containing the word Trump or Warren. The track parameter is an array of search terms to stream.
twitter_stream = Stream(auth, Listener())
twitter_stream.filter(track = ['Trump', 'Warren'])
Honored to be quoted in this piece along with amp Agree with Tribe s conclusion that obstructing

Boom

BREAKING New York Gov Andrew Cuomo just responded to Trump switching residency to Florida HE SAID THIS Good rid

I suspected but President Trump showed us how deep and dangerous it is

yall mad at yg for kicking a grown ass man off his stage at HIS event but yall won t be mad at donald trump for kicking

I see many long breadlines in the future under a President Warren

The greatest traitors to the Ummah in our time are the Saudi Regime and those who support it What other regime in thi

It has been 3 years and Donald Trump hasn t done anything wrong Donald Trump hasn t done a single thing of which he
Plotting the data
Now we are going to plot the sentiment of the data which we have got from twitter.
We will begin by importing the necessary libraries-
pandasis used for data manipulation.pyplotfrommatplotlibis used for drawing plots.FuncAnimationfrommatplotlib.animationis used for real-time plots.
%matplotlib notebook ensures that the plot is plotted in the jupyter notebook itself.
import pandas as pd
import matplotlib.pyplot as plt

from matplotlib.animation import FuncAnimation
%matplotlib notebook
Here we have set the style to fivethirtyeight which is an in-built matplotlib style.
plt.style.use('fivethirtyeight')
- We are going to show the recent 10000 tweet data on the plot. Hence we have set
frame_len = 10000. - We have set the canvas size to
9x6. - Then we are creating a function
animate()and inside that, we are going to read thesentiment.csvfile which contains the live data. - After that, we are copying the
Trumpsentiment data toy1andWarrensentiment data toy2. - Then we are checking the length. If length is less than 10000 we are plotting the data as it is otherwise we are only plotting the recent 10000.
FuncAnimation()makes an animation by repeatedly calling the functionanimate().The first parameter ofFuncAnimation()is the figure object used to get needed events, such as draw or resize.plt.gcf()gets the current figure.intervalsets the delay between frames in milliseconds.
frame_len = 10000
fig = plt.figure(figsize=(9,6))
def animate(i):
data = pd.read_csv('sentiment.csv')
y1 = data['Trump']
y2 = data['Warren']
if len(y1)<=frame_len:
plt.cla()
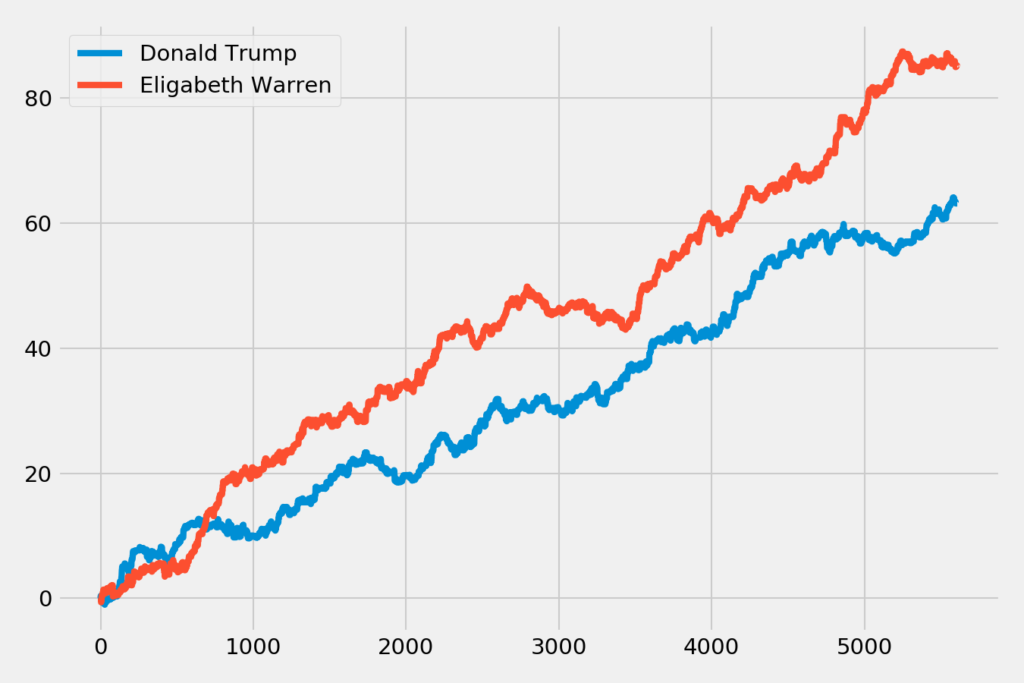
plt.plot(y1, label='Donald Trump')
plt.plot(y2, label='Elizabeth Warren')
else:
plt.cla()
plt.plot(y1[-frame_len: ], label='Donald Trump')
plt.plot(y2[-frame_len: ], label='Elizabeth Warren')
plt.legend(loc='upper left')
plt.tight_layout()
ani = FuncAnimation(plt.gcf(), animate, interval=1000)
Summary
We have seen many things in this project. We started by getting access to the keys. Then we authorized our API using the keys. After that, we scrapped live filtered tweets from twitter. We pre-processed them, found their sentiment, and stored the sentiment in a CSV file in a proper format. Then we read the CSV file and created a function that continuously plots the data. Further on you can change the keywords and filter tweets according to your need and draw various plots.


1 Comment